
First-pass dataset interrogation
A table can be wrong in four places, plus one domain-specific way. One pandas line for each, run on a real file, and what to do with the three findings that come back wrong.
The aim of the first pass over a new table is not a clean table. It is a short list of the things that look wrong, because that list decides what the rest of the analysis can claim, and one of the items on it is usually where the result lives or dies.
There are only four places a table can be wrong, plus one question that depends on what kind of data it is. Each one is a single line.
The five questions
| # | Question | Looks like |
|---|---|---|
| 1 | Rows. What is one row, and are any repeated or missing? | duplicates on the natural key, null counts |
| 2 | The axis. Usually time. Complete, evenly spaced, the same for every group? Which groups are short, and why? | rows per group, gaps between consecutive rows |
| 3 | The values. Does every column sit in a physically possible range? | min and max of everything, impossible combinations |
| 4 | The quantities the question needs. Build them once, look at their distribution and tails before using them. | the return, the volume measure, the target |
| 5 | What does this kind of data lie about? | splits, survivorship, look-ahead, leaked columns |
The fifth is the domain question; see common data-quality traps by dataset type. The first four are the same for every table.
Running them on a real file
The file is five years of daily prices for S&P 500 constituents, one row per ticker per day.
import pandas as pd, numpy as np

df = pd.read_csv("all_stocks_5yr.csv")
df["date"] = pd.to_datetime(df["date"])
df = df.rename(columns={"Name": "ticker"}).sort_values(["ticker", "date"]).reset_index(drop=True)
print(df.shape)
print(df.dtypes.to_dict())
(619040, 7)
{'date': dtype('<M8[ns]'), 'open': dtype('float64'), 'high': dtype('float64'), 'low': dtype('float64'), 'close': dtype('float64'), 'volume': dtype('int64'), 'ticker': dtype('O')}1. Rows
print("duplicate (date, ticker):", df.duplicated(["date", "ticker"]).sum())
print("nulls:", df.isna().sum()[lambda s: s > 0].to_dict())
duplicate (date, ticker): 0
nulls: {'open': 11, 'high': 8, 'low': 8}No duplicated keys. A handful of null opens, highs and lows; irrelevant if the analysis only uses the close, but worth writing down.
2. The axis
print(df["date"].min().date(), "->", df["date"].max().date(), "|", df["date"].nunique(), "trading days |", df["ticker"].nunique(), "tickers")

per = df.groupby("ticker").size()
print("rows per ticker: min", per.min(), " median", per.median(), " max", per.max())
print("tickers with full history:", (per == df["date"].nunique()).sum())
print("tickers with < 1000 rows:", (per < 1000).sum(), list(per[per < 1000].index[:8]), "...")

gap = df.groupby("ticker")["date"].diff().dt.days
print("largest gap between consecutive rows within a ticker:", gap.max(), "days | gaps > 5 days:", (gap > 5).sum())
2013-02-08 -> 2018-02-07 | 1259 trading days | 505 tickers
rows per ticker: min 44 median 1259.0 max 1259
tickers with full history: 470
tickers with < 1000 rows: 22 ['APTV', 'BHF', 'BHGE', 'CFG', 'CSRA', 'DWDP', 'DXC', 'EVHC'] ...
largest gap between consecutive rows within a ticker: 17.0 days | gaps > 5 days: 6Twenty-two tickers have short histories: spin-offs and recent listings. They add noise at the edges and little else. This needs a decision, not a description: drop anything under 1000 rows, or keep them and accept that the cross-section is thinner at the start.
3. The values
print(df[["open", "high", "low", "close", "volume"]].describe().loc[["min", "50%", "max"]].round(2).to_string())
print("high < low:", (df["high"] < df["low"]).sum())
print("close outside [low, high]:", ((df["close"] > df["high"]) | (df["close"] < df["low"])).sum())
print("zero volume:", (df["volume"] == 0).sum())
open high low close volume
min 1.62 1.69 1.50 1.59 0.0
50% 62.59 63.15 62.02 62.62 2082093.5
max 2044.00 2067.99 2035.11 2049.00 618237630.0
high < low: 1
close outside [low, high]: 9
zero volume: 4A few impossible rows. Not enough to matter for a cross-sectional study of five hundred names, but they are the kind of thing that must be named before someone else finds them.
4. The quantities the question needs
If the question is about returns, build the return once and look at it before anything else.
df["ret"] = df.groupby("ticker")["close"].pct_change()
print("daily return: mean %.5f  std %.4f  min %.3f  max %.3f" % (df["ret"].mean(), df["ret"].std(), df["ret"].min(), df["ret"].max()))
print("rows with |return| > 25%:", (df["ret"].abs() > 0.25).sum())
daily return: mean 0.00054 std 0.0161 min -0.626 max 1.010
rows with |return| > 25%: 46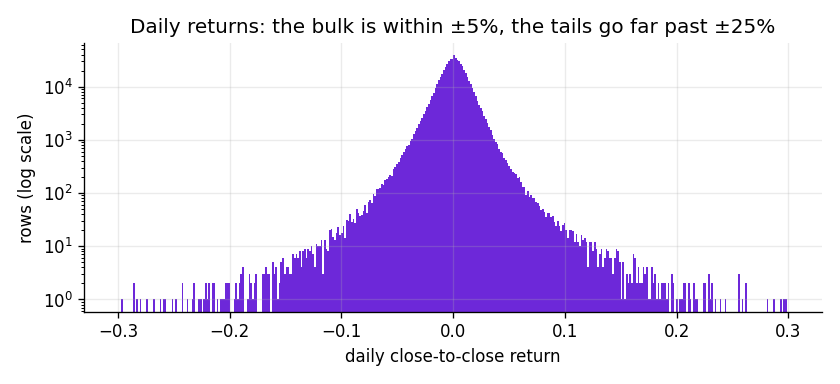
Forty-six single-day moves of more than 25%. A +101% day is either a real event or an unadjusted corporate action, and there is no time to check all forty-six. Check two by eye, then decide: drop them, or keep them and use ranks so that no single row can decide a day’s result.
5. What this kind of data lies about
Daily equity panels lie about three things: splits and spin-offs (an unadjusted 7-for-1 split looks like an 86% crash), survivorship (a file of today’s index members is missing every company that left the index or went bust during the period), and scale (volume differs by a hundredfold across names, so a raw volume number means nothing without the stock’s own history). This file is the index as it stood at the end of the period, so it is survivorship-biased, which cannot be fixed but must be said.
What the findings are for
Write the three that came back wrong on one line each, with a decision next to each:
- Twenty-two short histories → dropped (under 1000 rows).
- The file is the surviving constituents → survivorship bias flagged on every result; flatters anything that buys losers.
- Forty-six extreme moves, some of them unadjusted corporate actions → kept, neutralised by using ranks.
That list is the conversation to have with whoever set the question before modelling starts, and it is slide two of the presentation. Interrogation is not finished when the checks have run. It is finished when the findings have become decisions.
For any other table
The same five questions, with different lines for step 5. Five minutes of searching <data type> data quality issues or common pitfalls <data type> backtest gets the ten-line list of traps for a domain you have never worked in. See looking things up.