
Single series or panel: where the repeats come from
A panel gives hundreds of independent looks per day; a single series gives one. Why the same question is far harder to answer at the aggregate level, and what to use as the repeats when there is no cross-section.
“Does today’s return predict tomorrow’s?” has two readings. Cross-sectional: among the five hundred stocks, do today’s losers do better tomorrow than today’s winners? Single-series: does the market as a whole go up tomorrow when it went up today? The words are almost the same; the amount of evidence is not.
Where the repeats come from
On a panel the score is computed once per date across the cross-section, so five years give about 1,250 looks, each of them summarising ~480 stocks. On a single series each date gives one observation of one pair, so the same five years give one autocorrelation estimate, and the honest way to get repeats is to compute it in non-overlapping blocks: years, or quarters.
import pandas as pd, numpy as np

df = pd.read_csv("all_stocks_5yr.csv")
df["date"] = pd.to_datetime(df["date"])
df = df.rename(columns={"Name": "ticker"}).sort_values(["ticker", "date"]).reset_index(drop=True)
per = df.groupby("ticker").size()
df = df[df["ticker"].isin(per[per >= 1000].index)].copy()
df["ret"] = df.groupby("ticker")["close"].pct_change()

mkt = df.groupby("date")["ret"].mean().dropna()            # equal-weight market return, one number per day
m = pd.DataFrame({"r": mkt})
m["r_next"] = m["r"].shift(-1)
m = m.dropna()
print("days:", len(m), "| mean %.5f  std %.4f" % (m["r"].mean(), m["r"].std()))
days: 1257 | mean 0.00055 std 0.0080One estimate, and its false precision
rho = m["r"].corr(m["r_next"])
print("lag-1 autocorrelation over all days: %+.4f   (naive se ~ 1/sqrt(n) = %.4f)" % (rho, 1 / np.sqrt(len(m))))
lag-1 autocorrelation over all days: -0.0036 (naive se ~ 1/sqrt(n) = 0.0282)The naive standard error treats every day as an independent draw from one stable process. Days are close to independent, but the process is not stable, and one number over five years hides that.
Blocks as the repeats
by_year = m.groupby(m.index.year).apply(lambda d: d["r"].corr(d["r_next"]))
print("per year:", by_year.round(3).to_dict())
print("mean across years %+.4f   t across years %+.2f   (n = %d years)" % (by_year.mean(), by_year.mean() / (by_year.std() / np.sqrt(len(by_year))), len(by_year)))

by_q = m.groupby(m.index.to_period("Q")).apply(lambda d: d["r"].corr(d["r_next"]) if len(d) > 10 else np.nan).dropna()
print("per quarter: mean %+.4f   t %+.2f   n = %d   share > 0: %.2f" % (by_q.mean(), by_q.mean() / (by_q.std() / np.sqrt(len(by_q))), len(by_q), (by_q > 0).mean()))
per year: {2013: -0.055, 2014: 0.015, 2015: 0.054, 2016: -0.051, 2017: -0.087, 2018: 0.124}
mean across years +0.0001 t across years +0.00 (n = 6 years)
per quarter: mean -0.0382 t -1.34 n = 21 share > 0: 0.38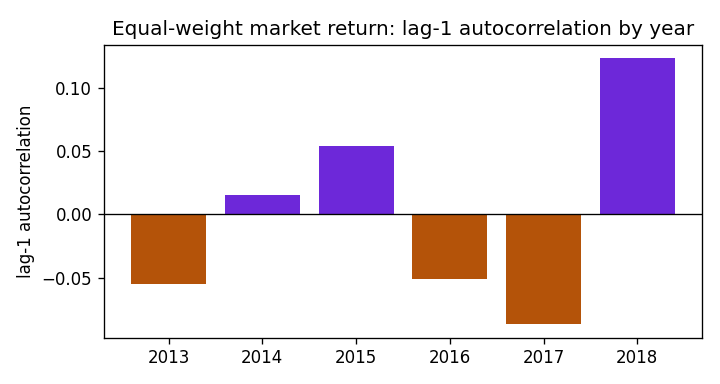
The sign flips from year to year and the mean across years is indistinguishable from zero. With six yearly repeats the t-statistic has almost no power, which is the correct amount of confidence to have about a single series over five years. (The rank version of the same per-year numbers is negative in every year; the case study shows what to do when a measure the protocol did not name disagrees with the one it did.)
The sign, against the majority-class rate
For a binary reading of the same question, the baseline is the share of up days, not 50%.
up = m["r_next"] > 0
same_sign = (m["r"] > 0) == up
print("share of up days: %.3f | 'same sign as today' accuracy: %.3f | 'opposite sign' accuracy: %.3f" % (up.mean(), same_sign.mean(), (~same_sign).mean()))
share of up days: 0.558 | 'same sign as today' accuracy: 0.472 | 'opposite sign' accuracy: 0.528Always predicting “up” beats either rule. See logistic regression with a majority-class baseline.
What this means for a study
- If the question can be read cross-sectionally, read it that way. The evidence is hundreds of times richer.
- If it must be single-series, say up front that the repeats are years or quarters, report the by-block numbers, and expect the answer to be “not distinguishable from zero”.
- Do not report a single-series t-statistic computed as if 1,250 days were 1,250 independent trials of a stable effect. It is not wrong arithmetic; it is the wrong question.
The complete version of this analysis, under a fixed protocol, is the market-level autocorrelation case study.