
Feature decay across horizons
The same signal scored against forward outcomes of increasing horizon, cumulative and day-by-day, with the overlap correction applied. Two examples with opposite shapes, sign versus size.
A signal that works one day ahead may work for a week or die by day two. Scoring it against forward outcomes of increasing horizon answers two questions at once: how long the information lasts, and therefore how often a position based on it would have to be turned over.
Setup
import pandas as pd, numpy as np

df = pd.read_csv("all_stocks_5yr.csv")
df["date"] = pd.to_datetime(df["date"])
df = df.rename(columns={"Name": "ticker"}).sort_values(["ticker", "date"]).reset_index(drop=True)
per = df.groupby("ticker").size()
df = df[df["ticker"].isin(per[per >= 1000].index)].copy()
g = df.groupby("ticker")
df["ret"] = g["close"].pct_change()
df["sig1"] = -df["ret"]
df["vol20"] = g["ret"].transform(lambda x: x.rolling(20).std())
df["relvol"] = df["volume"] / g["volume"].transform(lambda x: x.rolling(20).mean())
test_start = pd.Timestamp("2016-06-30") + pd.Timedelta(days=7)

def daily_ic(d, sig, tgt):
    return d.groupby("date")[[sig, tgt]].apply(lambda x: x[sig].corr(x[tgt], method="spearman")).dropna()

def line(ic, h):
    m, s, n = ic.mean(), ic.std(), len(ic)
    t = m / (s / np.sqrt(n))
    return "h = %2d   mean IC %+.4f   naive t %+.2f   overlap-adjusted t %+.2f   days %d" % (h, m, t, t / np.sqrt(h), n)
Cumulative horizon: signal against the next h days’ return
for h in (1, 2, 3, 5, 10, 20):
    col = "fwd%d" % h
    df[col] = g["ret"].transform(lambda x: x.shift(-h).rolling(h).sum())     # days t+1 .. t+h
    d = df[df["date"] > test_start].dropna(subset=["sig1", col])
    print(line(daily_ic(d, "sig1", col), h))
h = 1 mean IC +0.0156 naive t +1.98 overlap-adjusted t +1.98 days 399
h = 2 mean IC +0.0091 naive t +1.19 overlap-adjusted t +0.84 days 398
h = 3 mean IC +0.0061 naive t +0.80 overlap-adjusted t +0.46 days 397
h = 5 mean IC +0.0031 naive t +0.42 overlap-adjusted t +0.19 days 395
h = 10 mean IC +0.0076 naive t +1.06 overlap-adjusted t +0.34 days 390
h = 20 mean IC +0.0031 naive t +0.43 overlap-adjusted t +0.10 days 380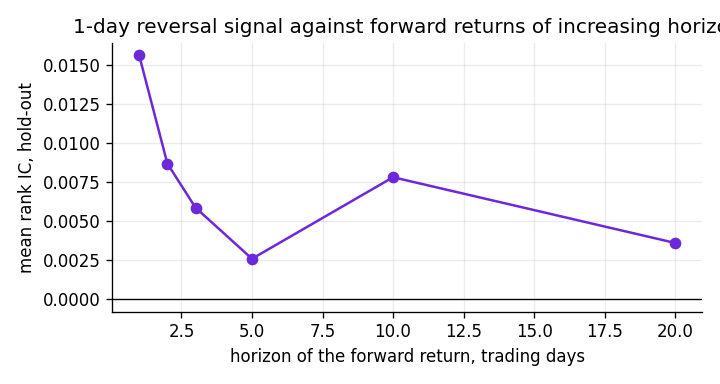
For horizons above one day, consecutive days’ targets overlap, so the naive t-statistic overstates the evidence; dividing by is the conservative correction. See t-statistics from repeated looks.
Day-by-day: signal against the return on day t+k alone
The cumulative view can hide where the information sits. The day-by-day view shows it.
for k in (1, 2, 3, 4, 5):
    df["r_k"] = g["ret"].shift(-k)
    d = df[df["date"] > test_start].dropna(subset=["sig1", "r_k"])
    ic = daily_ic(d, "sig1", "r_k")
    print("day t+%d alone   mean IC %+.4f   t %+.2f   days %d" % (k, ic.mean(), ic.mean() / (ic.std() / np.sqrt(len(ic))), len(ic)))
day t+1 alone mean IC +0.0156 t +1.98 days 399
day t+2 alone mean IC -0.0036 t -0.49 days 398
day t+3 alone mean IC -0.0057 t -0.82 days 397
day t+4 alone mean IC -0.0045 t -0.66 days 396
day t+5 alone mean IC +0.0085 t +1.21 days 395For one-day reversal the information is entirely in the next day and there is nothing on days two to five. A position would have to be turned over daily, which is what the cost analysis finds.
A signal with a slower decay: size instead of sign
Relative volume predicts the size of tomorrow’s move. Sizes are persistent, so the same exercise gives a different shape.
df = df.replace([np.inf, -np.inf], np.nan)
for h in (1, 2, 3, 5, 10, 20):
    col = "size%d" % h
    df[col] = g["ret"].shift(-h).abs() / df["vol20"]                        # the move on day t+h alone, normalised
    d = df[df["date"] > test_start].dropna(subset=["relvol", col])
    ic = daily_ic(d, "relvol", col)
    print("day t+%2d alone   mean IC %+.4f   t %+.2f   days %d" % (h, ic.mean(), ic.mean() / (ic.std() / np.sqrt(len(ic))), len(ic)))
day t+ 1 alone mean IC +0.1010 t +29.36 days 399
day t+ 2 alone mean IC +0.0632 t +20.62 days 398
day t+ 3 alone mean IC +0.0495 t +15.08 days 397
day t+ 5 alone mean IC +0.0305 t +9.61 days 395
day t+10 alone mean IC +0.0226 t +7.10 days 390
day t+20 alone mean IC +0.0204 t +6.50 days 380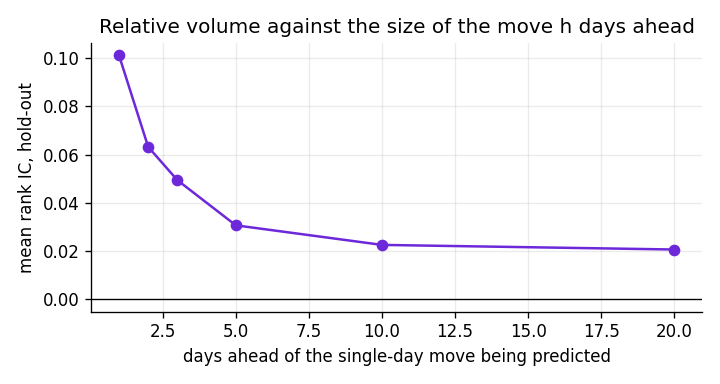
The IC halves by day two and is still clearly positive at day twenty. Volatility information is slow; direction information, on this data, does not survive the night. See the relative volume case study.
Reading a decay curve
- Falls to zero after day one: the effect is short-lived, possibly microstructure (bid-ask bounce). High turnover is unavoidable.
- Decays smoothly over weeks: a persistent state variable. Positions can be held; costs matter less.
- Rises with horizon: suspicious. Either the target’s overlap is inflating things or the signal is proxying for a slow-moving characteristic, and the overlap-adjusted t is the number to trust.